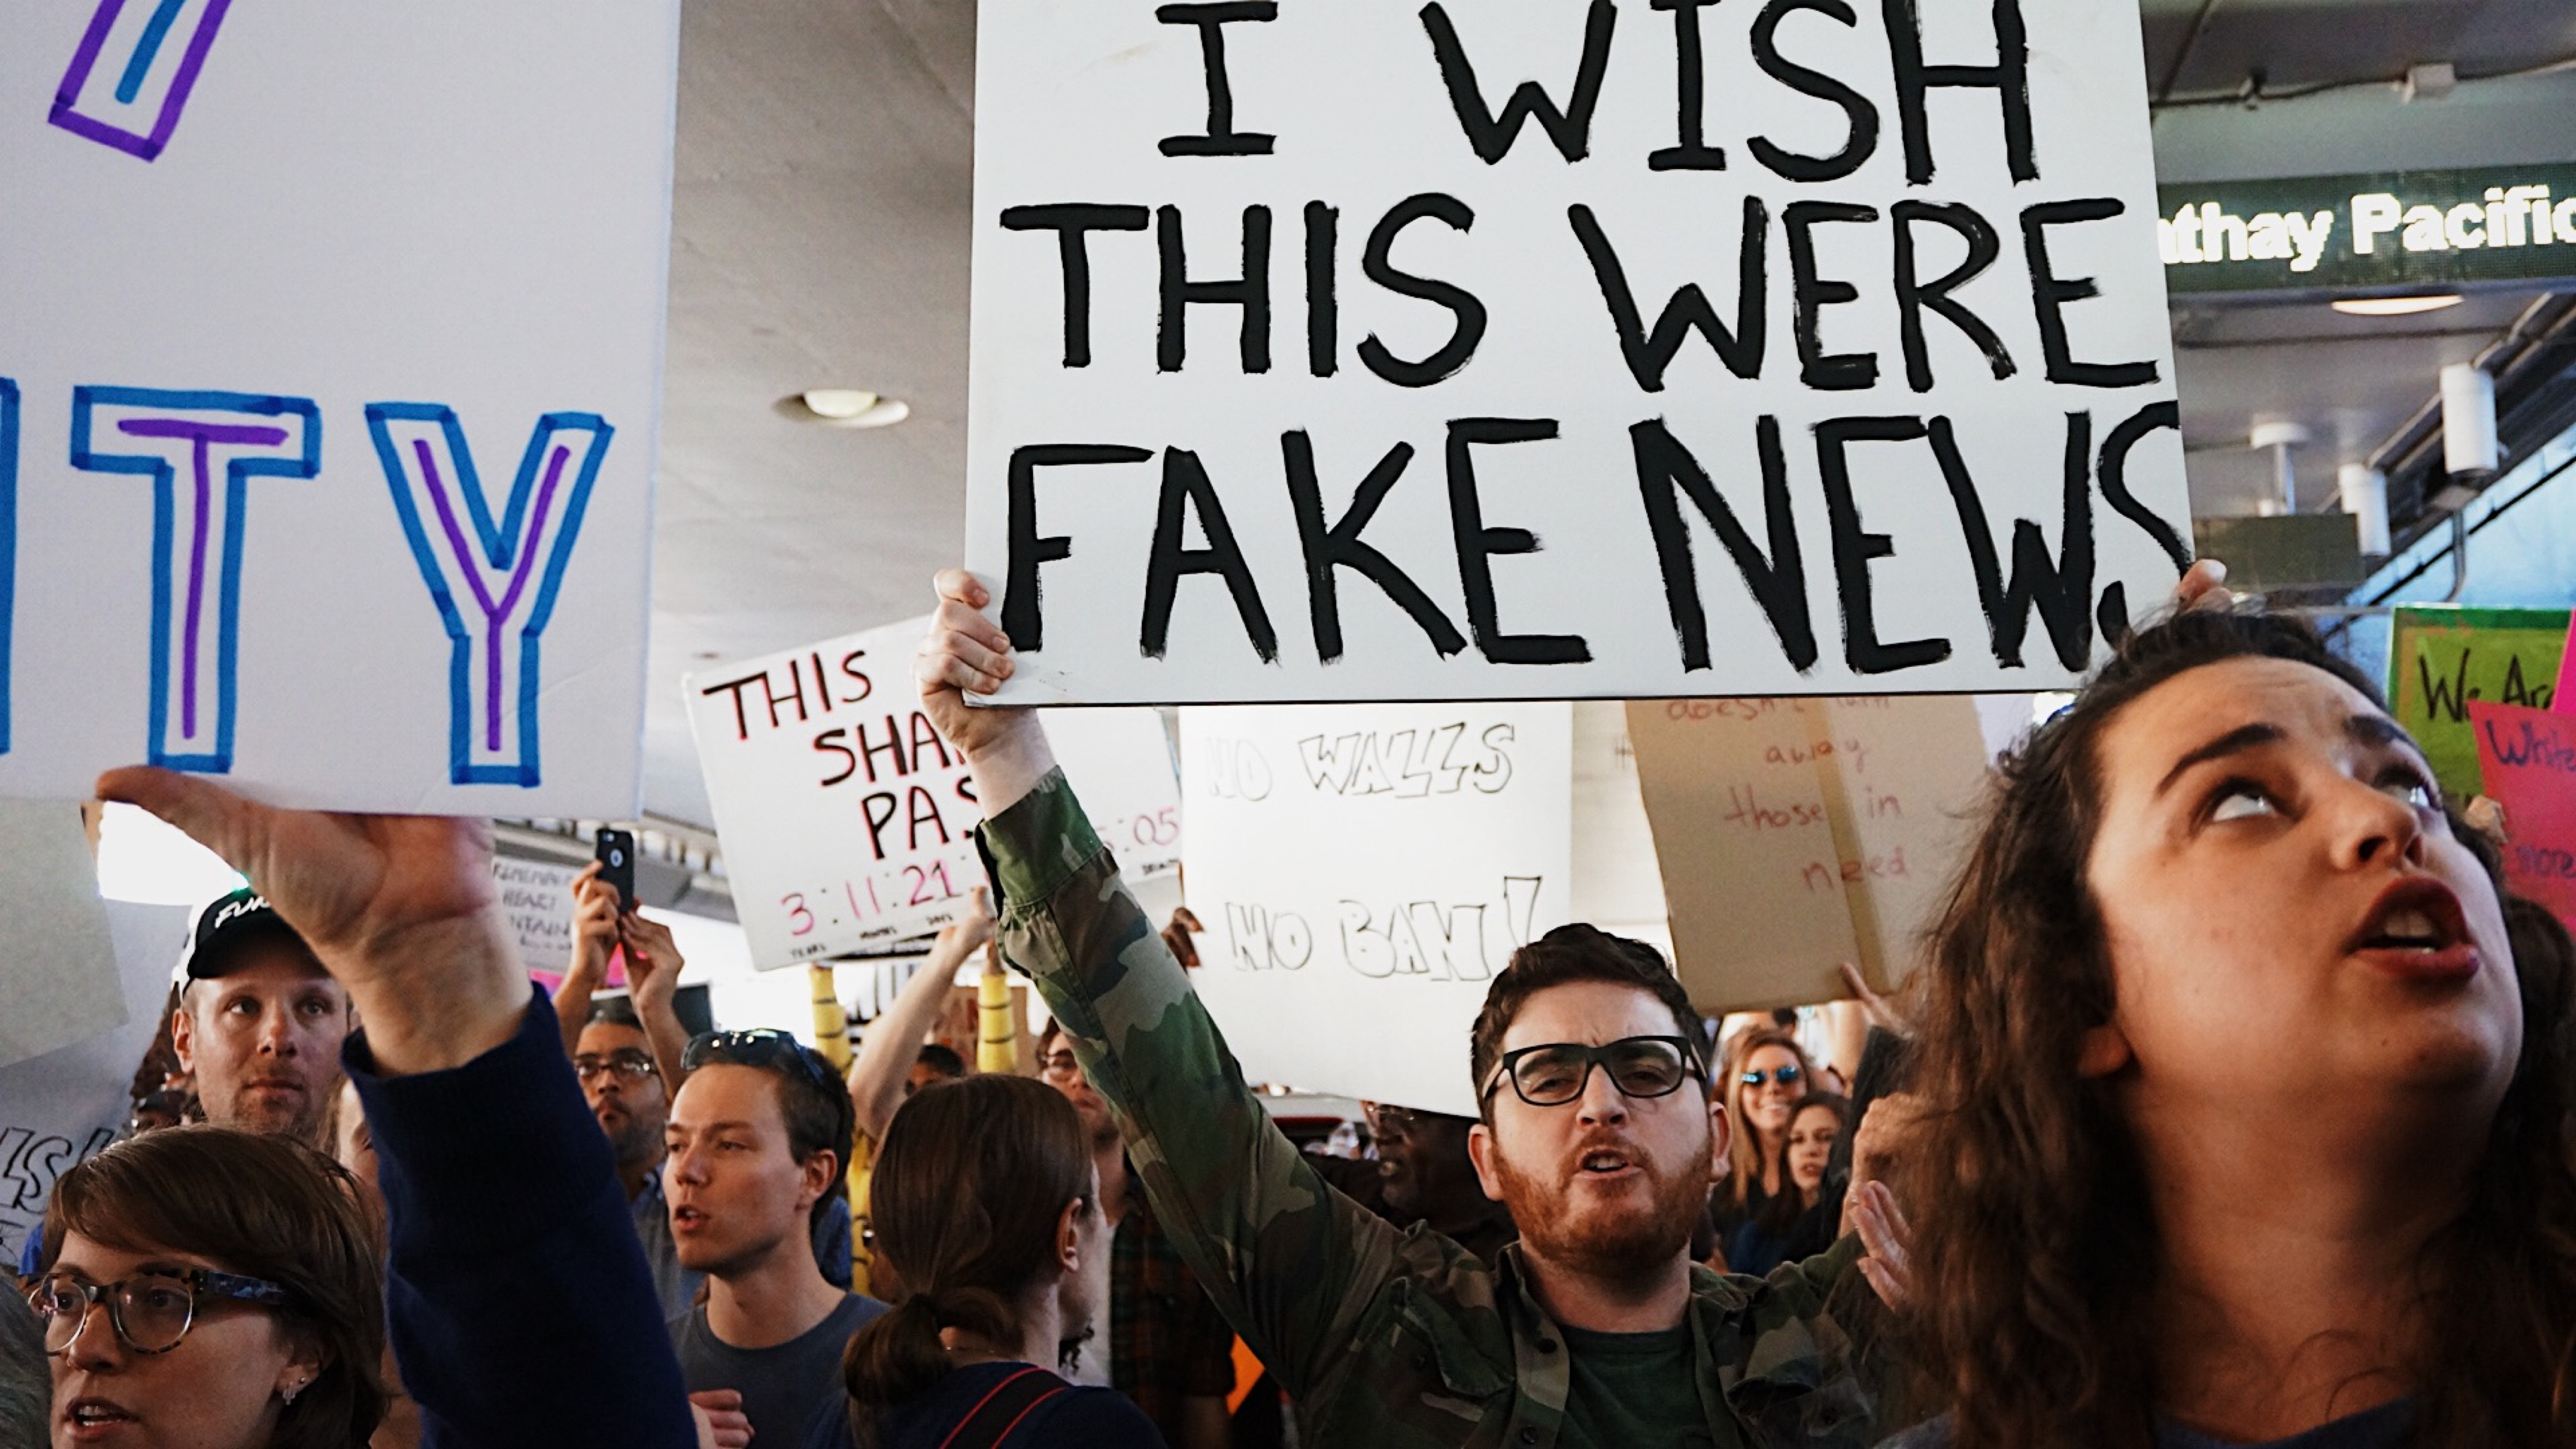
Using a Passive-Aggressive Model to classify fake
news. The model used is an "online" learning model that iteratively classifies a
datapoint as "Real" or "Fake". If it gets it right, no adjustments are made, ergo the Passive,
while if it gets it wrong, the decision weights are adjusted to get it righ. It is, in theory, a
good model to classify a real time flow of data that is separable, that is, the classification
line is well defined.

This was a project under the Data Analytics for Finance
subject at Nova SBE. The objective was to evaluate the performance of a quantitative investment
strategy using common performance evaluation techniques. The quality of the project was be based
on the quality of the analysis, not the performance of the strategy. As such, a well-executed
analysis of a strategy that performs poorly was perfectly acceptable.

In this project, under the Machine Learning subject at Nova SBE, we using a dataset from a large
service provider of online advertising and digital marketing containing ads shown during 10 days
we wanted to predict if a user will click or not click on an ad taking special attention to the
role of the website, the position and display of the add and other features that can be
controlled by the advertiser. Click Here for
the presentation's pdf

In the final project of this subject we had to create a small website using React - Project DEMO - with interactive elements, simulating a
the addition of Car trips and respective drivers. Alongside with the front-end, we had a
back-end which stored the inputs while the server was running.

Data Analysis and Exploration using R and a Report summary of the exploration,
answering specific questions and suggesting a possible redesign of the experince. This was done
in the context of the subject Marketing Analytics during my Masters in Finance at Nova School of
Business and Economics.

A project leveraging jupyter-notebook widgets and data visualization modules in order to
facilitate initial data exploration. This was done in the context of working for the DSKC and it
is only part of the iterations that led to the final project. However it is still fully
functional and I use it on my day to day.

A quick data analysis on a merged AirBnB dataset of Lisbon & Porto listings aiming to predict,
using only 3 features and as few visualizations as possible, if a listing would be available in
the next 280 days or not. This a fun project specially when trying to choose what features to
use and scaling down only to meaningfull visualizations.

This project consisted on scrapping the Top 100 IMDb movies and anwer questions using pandas and
numpy in the context of the subject Data Curation during my Masters in Finance at Nova School of
Business and Economics. I have made a personal addtion to the project providing useful
visualizations for the different challenges.

This is a group project from my masters degree in Finance for the Data Visualization Course where
we merged 5 World Happiness Report Datasets and performed a Data Analysis and visualization
trying to extract trends and infer possible causality for different happiness factors.
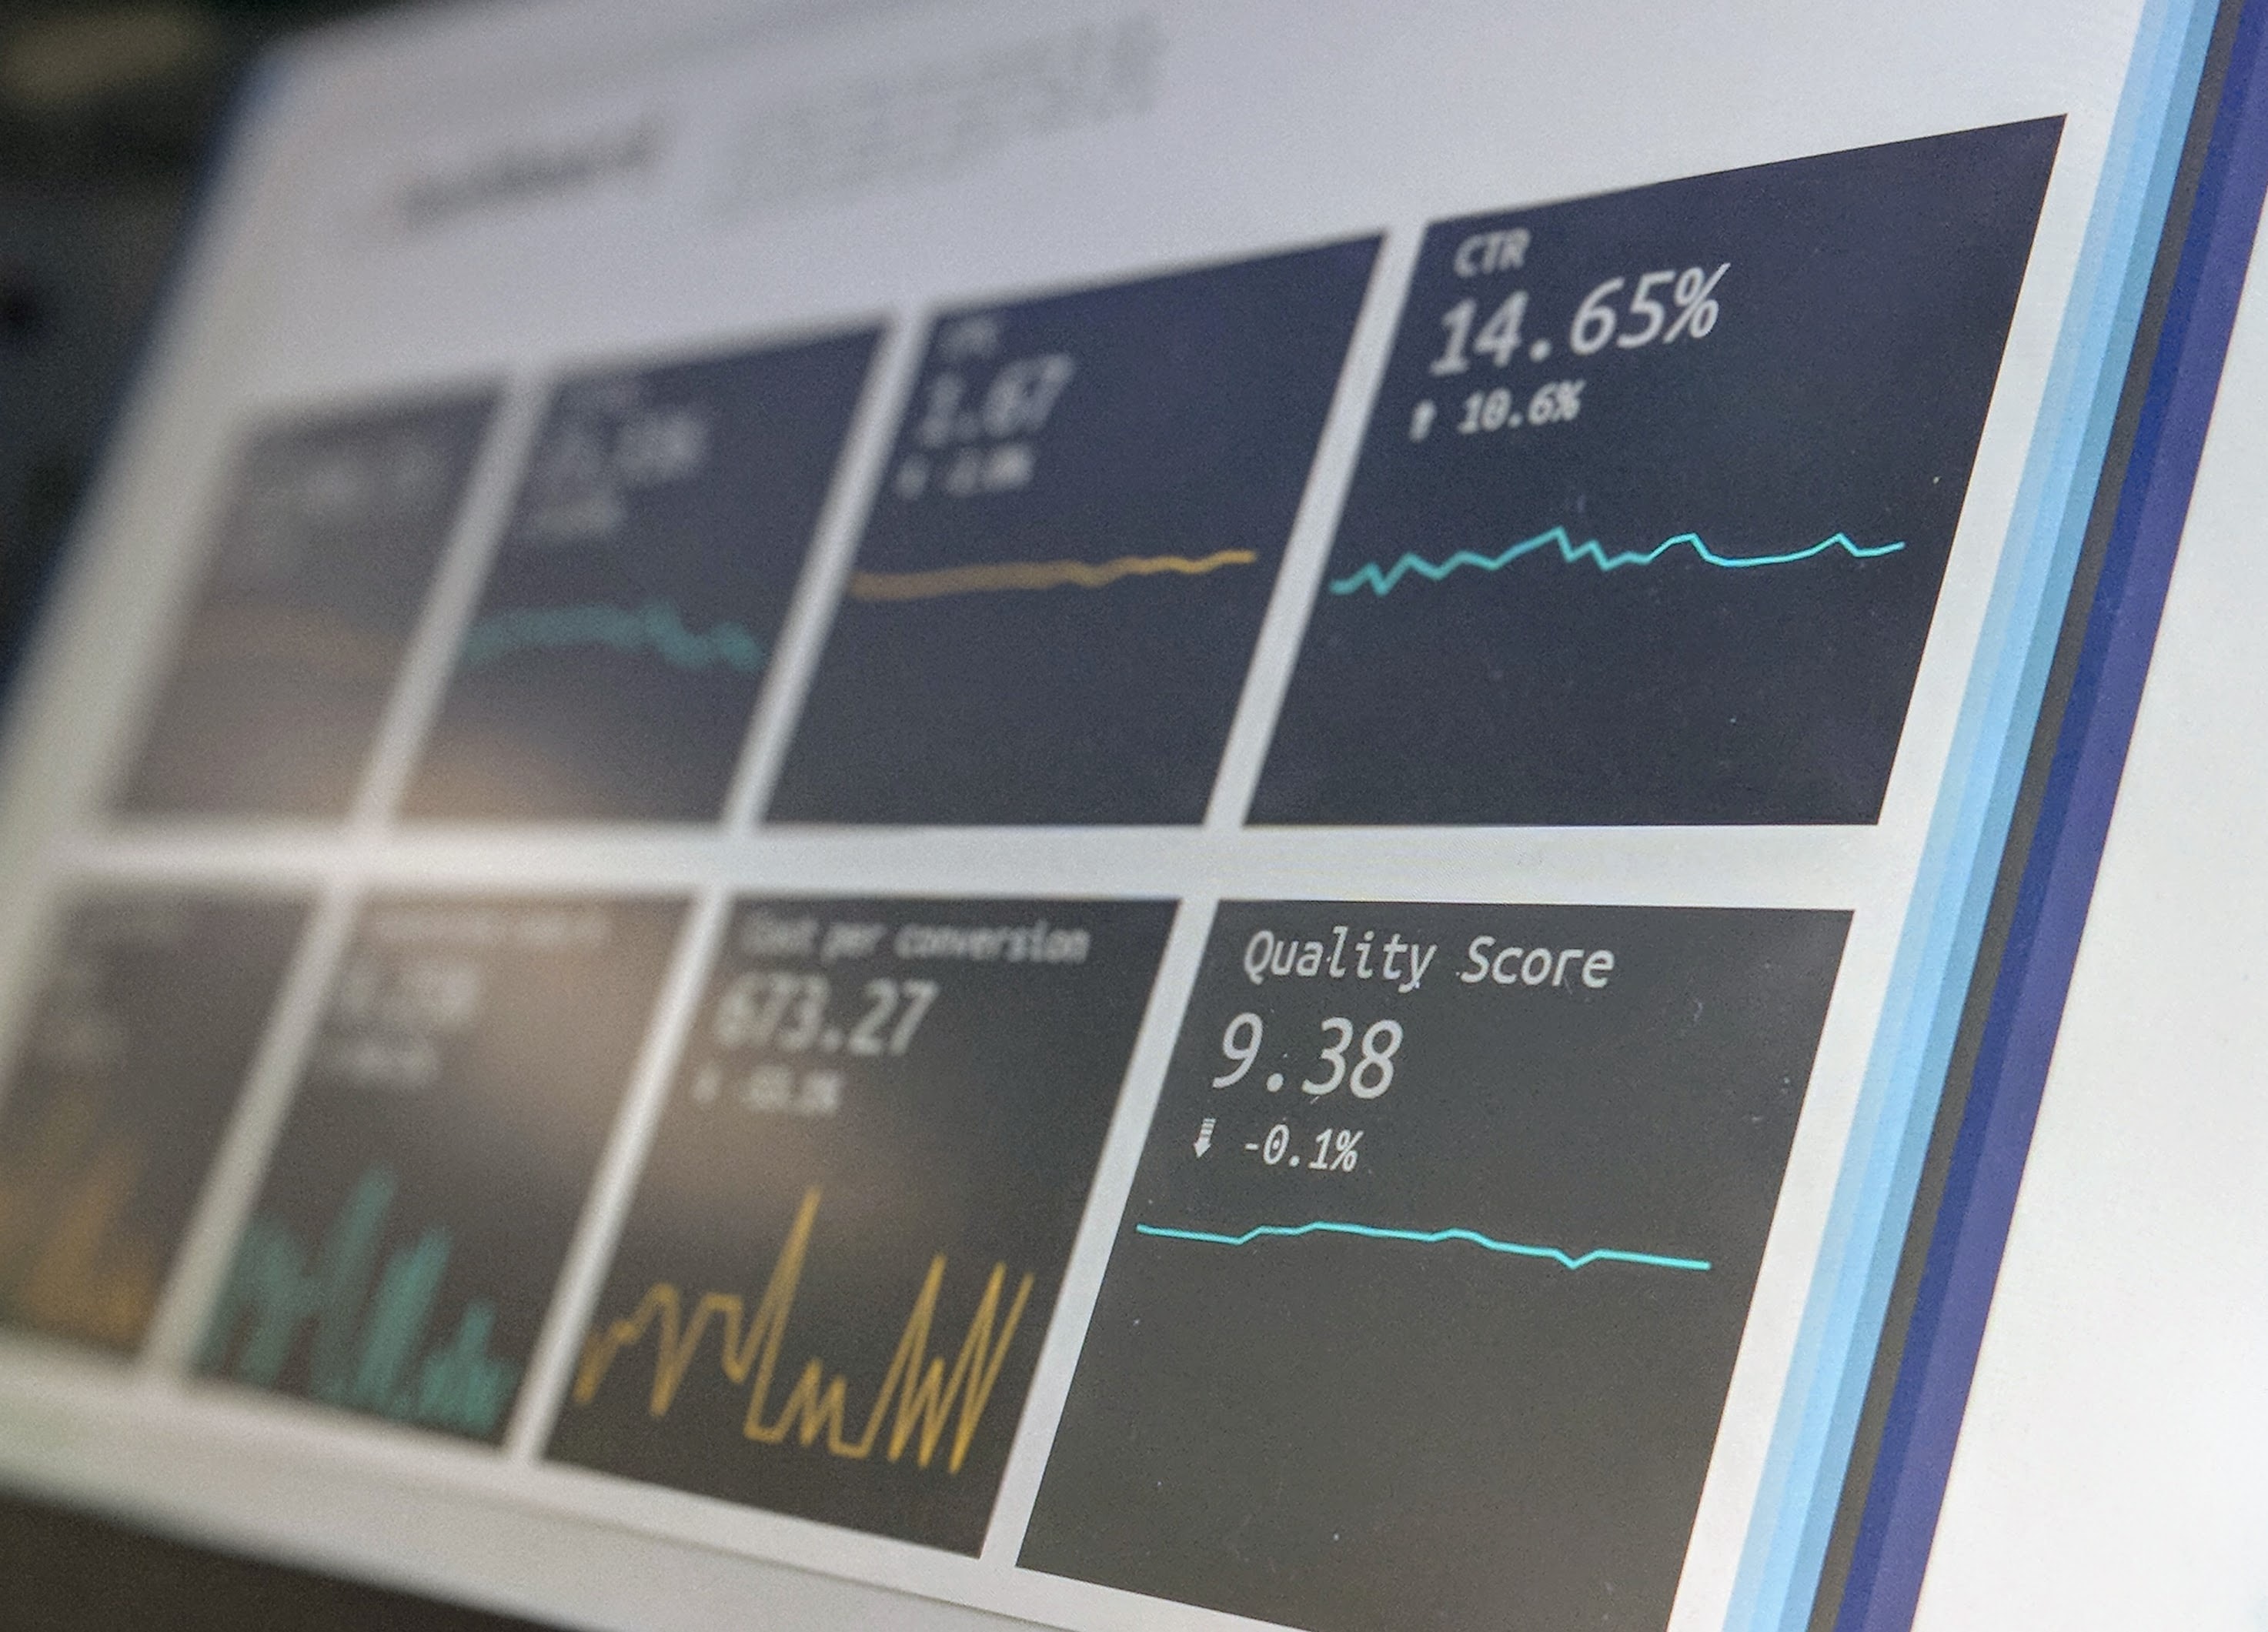
Personal project to create a dashbord to check the evolution of my investment portfolio. It was
also a way to develop my skills in Dash and Plotly libraries and well as some API data requests,
connecting google Drive, google Sheets and Google Data Studio to have an updated portfolio
anytime I ran the script.

